jmathanim
A Java library to make mathematical animations
Project maintained by davidgutierrezrubio Hosted on GitHub Pages — Theme by mattgraham
Basic Objects
The Vec class
The Vec class represents a 2D vector (although it includes the z-coordinate too). All coordinates in the math view are represented by this class. Several methods are implemented for this class. For example, methods add and mult add 2 vectors or multiply by a scalar, returning a new vector object with the result. These methods have the versions addInSite and multInSite which return void and change the original vector.
Vec u=Vec.to(4,5);//Creates a vector with coordinates (4,5)
double x=v.x;//The x-coordinate of the vector
double y=v.y;//The x-coordinate of the vector
double norm=v.norm();//returns the euclidean norm of the vector.
v.scale(3);//Multiplies the vector v by 3. The vector v is modified.
v.shift(w);//Adds w to v
Vec vw=v.to(vw);//Returns the vector w-v. The original vectors are unaltered
double dot=w.dot(v);//Computes the dot product of v and w
double angle=v.getAngle();//Returns the angle of v, from 0 to 2*PI
The Point class
Everything that you can draw on the screen is a subclass of the MathObject class (more precisely, everything that implements the Drawable interface). So, they share a few common methods, like scale, rotate or shift. We’ll see these methods later.
The Point class is the most basic MathObject and, yes, you’re right, it represents a single point.
Point p = Point.at(1,1); //You can create a point using static constructors
Point q = Point.origin();//Same as Point.at(0,0)
A ` Point object contains a Vec` object which stores its coordinates.
Vec v=p.getVec(); //Coordinates of Point p
double x=p.getVec().x; //x-coordinate of p
double d=p.norm(); //Distance of p to the origin
Vec AB=A.to(B); //Vector from Point A to Point B
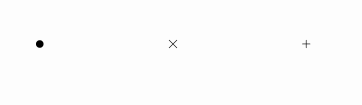
A point can be represented in different styles, defined in the DotStyle enum, namely CIRCLE, CROSS, PLUS, etc, which are shown as this:
The code used was
@Override
public void setupSketch() {
    config.parseFile("#preview.xml");
    config.parseFile("#light.xml");
}

@Override
public void runSketch() throws Exception {
    Point A = Point.at(-1.75, 0).dotStyle(DotStyle.CIRCLE);
    Point B = Point.at(-1.25, 0).dotStyle(DotStyle.CROSS);
    Point C = Point.at(-.75, 0).dotStyle(DotStyle.PLUS);
    Point D = Point.at(-.25, 0).dotStyle(DotStyle.RING);
    Point E = Point.at(.25, 0).dotStyle(DotStyle.TRIANGLE_UP_HOLLOW);
    Point F = Point.at(.75, 0).dotStyle(DotStyle.TRIANGLE_DOWN_HOLLOW);
    Point G = Point.at(1.25, 0).dotStyle(DotStyle.TRIANGLE_UP_FILLED);
    Point H = Point.at(1.75, 0).dotStyle(DotStyle.TRIANGLE_DOWN_FILLED);
    add(A, B, C,D,E,F,G,H); //Add the 3 points to the scene

    //Add an x-axis line, gray, under the points, for reference
    add(
        Line.XAxis()
        .thickness(2)
        .drawColor("gray")
        .layer(-1)
    );

    waitSeconds(5); //Give me time to do a screenshot!
    }
The code in the setupSketch method loads default presets to preview the animation by creating a movie file and using a style with a white background. We will consistently use this style for the rest of the manual. You can read more about configuration files in the styling chapter.
The Shape class
This class represents a shape defined by a curve. The truth is, it represents more than that, as it can represent a closed or open curve, or even a curve defined by many disconnected pieces.
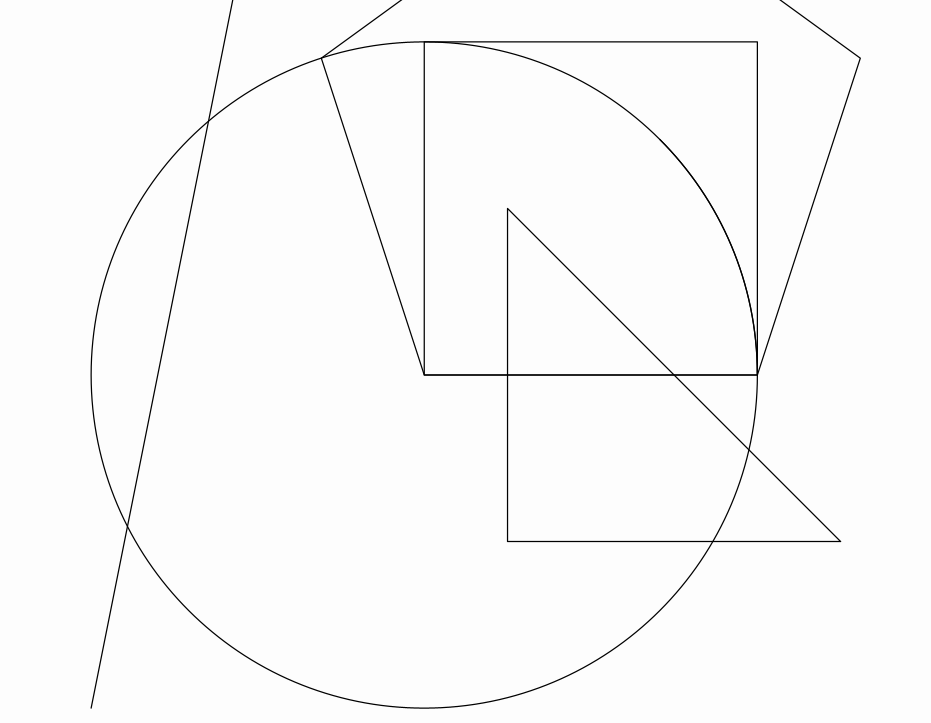
Several convenient static methods are defined to easily create the most common shapes:
//Generates a circle with radius 1 and centered at (0,0)
Shape circ=Shape.circle();

//Generates a unit-square, with lower left cornet at (0,0)
Shape sq=Shape.square();

//A regular pentagon, with 2 first vertices at (0,0) and (1,0)
Shape reg=Shape.regularPolygon(5);

//A closed polygon (in this case, a triangle)
Shape poly=Shape.polygon(Point.at(.25,-.5),Point.at(1.25,-.5),Point.at(.25,.5));


//A rectangle with their sides parallel to the axes, with lower left and upper right vertices at (1,2) and (3,5) respectively.
Shape rect=Shape.rectangle(Point.at(1,2),Point.at(3,5));

//A segment specified by the given points
Shape seg=Shape.segment(Point.at(-1,-1),Point.at(-.5,1.5));

//An arc centered at (0,0) with radius 1, and arclength of PI/4 radians
Shape arc=Shape.arc(PI/4);
add(circ, sq, reg, poly, rect, seg, arc);//Add everything to the scene
waitSeconds(5);//5 seconds of contemplation...
You’ll obtain something like this:
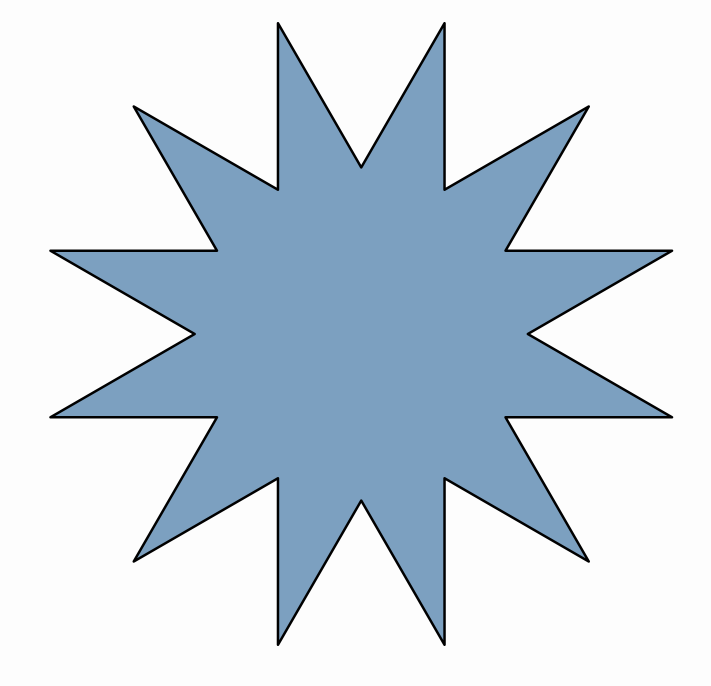
From version 0.9.8, Shapes can also be defined using LOGO commands:
String logoCmd = "REPEAT 12 [FD .5 RT 150 FD .5 LT 120] CLO";//The CLO command is an non-LOGO command added to close the path
Shape logoShape = Shape.logo(logoCmd);
add(logoShape.center().style("solidblue"));//Centered on screen and with a style filled blue
waitSeconds(3);
Which gives the following image for 3 seconds:
The implemented LOGO commands are the following:
FORWARD or FD
BACKWARD or BK
RIGHT or RT
LEFT or LT
REPEAT
PENUP or PU
PENDOWN or PD
A full reference of these commands can be found for example here.
Apart from these the CLO (or CLOSE) command is added to close the generated path. Commands are case -insensitive so you can use “FD” or “fd”.
The Shape inherits from the AbstractShapeclass and is one of the most important and the most likely to be animated. Several other classes depend on it.
Other methods
Each Shape object has a JMPath object which stores and manages the path represented. Each point of the path can be accessed with the method
getPoint(n). This is a circular array and zero-based. That is, if you have the object pentagon which is a shape with 5 vertices, pentagon.getPoint(0) will give you the first point of the shape, pentagon.getPoint(1) the second one,…and pentagon.getPoint(5) instead of giving you an error, will return again the first point of the path. In the chapter “Dealing with paths” we see in more depth the path structure and how to access to its elements.
In the Shape objects, apart from the .getCenter()method, which returns the center of its bounding box, there is also the .getCentroid()method which computes the centroid of the shape, defined by the average point of all its vertices. This method effectively returns the geometrical center of a regular polygon for example, instead of the .getCenter()method.
The LatexMathObject class
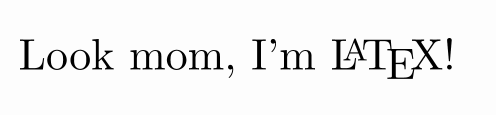
If you want to include mathematical expressions in any work, the best software to use is LaTeX. This class renders a mathematical expression written in LaTeX and imports it so you can draw it and animate it in several ways. So, if you put the following code in the runSketch() method:
LatexMathObject text = LatexMathObject.make("Look mom, I'm \\LaTeX!");
add(text);
waitSeconds(5);
A minor drawback when combining LaTeX and Java, is that one of the most used symbols in LaTeX is the backslash “\”, and Java doesn’t accept single backslashes in its strings, so if you want to compile a LaTeX formula like this
$$\int_0^\infty e^{-x}\,dx=1$$
You’ll have to replace every single backslash “\” with a double one “\\”:
LatexMathObject formula = LatexMathObject.make("$$\\int_0^\\infty e^{-x}\\,dx=1$$");
add(formula);
waitSeconds(5);
Otherwise, you will get an error. Fortunately, most common Java IDEs, like Netbeans, automatically perform this change when copy-pasting an already written formula into the code editor.
By default, LaTeX formulas are placed at the center of the screen.
Some commands, like \begin{verbatim} for example, are not supported by JLaTeXMath, so another method can be used. If you have a working LaTeX system installed in your computer you can specify that JMathAnim uses it to compile the text, by passing an optional argument:
LatexMathObject formula=LatexMathObject.make(text, LatexMathObject.CompileMode.CompileFile);
This method will compile to a .dvi file, convert it to .svg and import it into a MultiShapeObject. If the .svg file was already generated in previous runs, JMathAnim will reuse it.
The Line class
This class represents an infinite line. Of course, the “trick” is that in every frame it draws the visible part. Several static builders are implemented:
Point A = Point.at(1, 1);
Point B = Point.at(0, 1);
Vec v = Vec.to(1, .2);
Line line1 = Line.make(A, B).drawColor("red").thickness(6);//Line that pass through A and B, color red
Line line2 = Line.make(A, v).drawColor("blue").thickness(10);//Line that pass through A and A+v, color blue
Line line3 = Line.XAxis().drawColor("darkorange");//Line y=0, color dark orange
Line line4 = Line.YAxis().drawColor("darkmagenta");//Line x=0, color dark magenta
Line line5 = Line.XYBisector().drawColor("darkgreen");//Line y=x, color dark green
add(line1, line2, line3, line4, line5);//Add everything to the scene
play.shift(5, -1, -1.5, A);//Animates the point A moving (-1,-1.5) for 5 seconds
waitSeconds(3);
Note that the construction of line2 only considers the direction vector at the build time. When moving the A point, the direction changes.
Similarly, the Ray class allows us to represent rays in a similar way toLine objects.
The Axes class
The Axes class represents a cartesian axis. Well, actually it is just a container for a couple of Line objects (the x-axis and y-axis), Shape objects (the ticks), and LatexMathObject (the legends of the ticks).
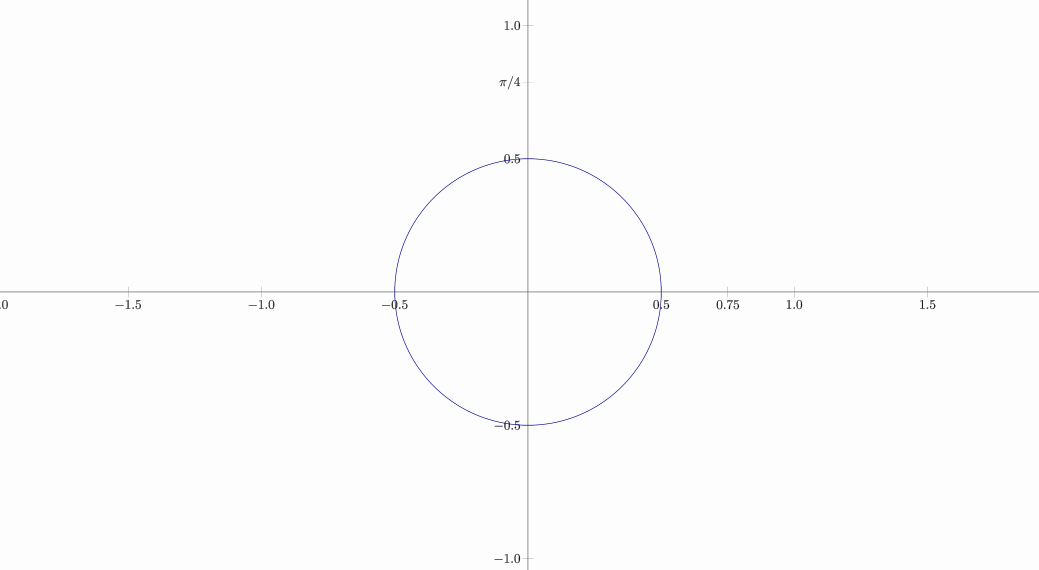
By default, axes without ticks are created. You can add them with the methods generatePrimaryXTicks and generatePrimaryYTicks. If you want to fine-tune the ticks, you can add individual ticks with latex expressions:
Axes axes = Axes.make();
axes.generatePrimaryXTicks(-2, 2, .5);//Generate x ticks -2, -1.5, -1, ..., 1.5, 2
axes.generatePrimaryYTicks(-2, 2, .5);//Generate y ticks -2, -1.5, -1, ..., 1.5, 2
axes.addXTicksLegend(0.75,TickAxes.TickType.PRIMARY);//Adds a tick at x=0.75, type primary tick.
axes.addYTicksLegend("$\\pi/4$", PI / 4,TickAxes.TickType.PRIMARY);//Adds a tick at y=PI/4 with legend $\\pi/4$
add(axes, Shape.circle().scale(.5).drawColor("darkblue"));//Add axes and a blue circle
waitSeconds(5);//Time for a screenshot!
The CartesianGrid class
The name says it all!
//A grid with reference point (0.0) and
//2 subdivisions for secondary grid
CartesianGrid grid = CartesianGrid.make(0, 0, //Center of grid, usually (0,0)
                                        2, //Number of horizontal divisions for the secondary grid
                                        2//Number of vertical divisions for the secondary grid
                                       );
add(
    grid,
    Shape.circle() //A circle
        .drawColor("blue") //drawn in blue
        .fillColor("blue") //filled also in blue
        .fillAlpha(.5) //with opacity 50%
);
waitSeconds(3);
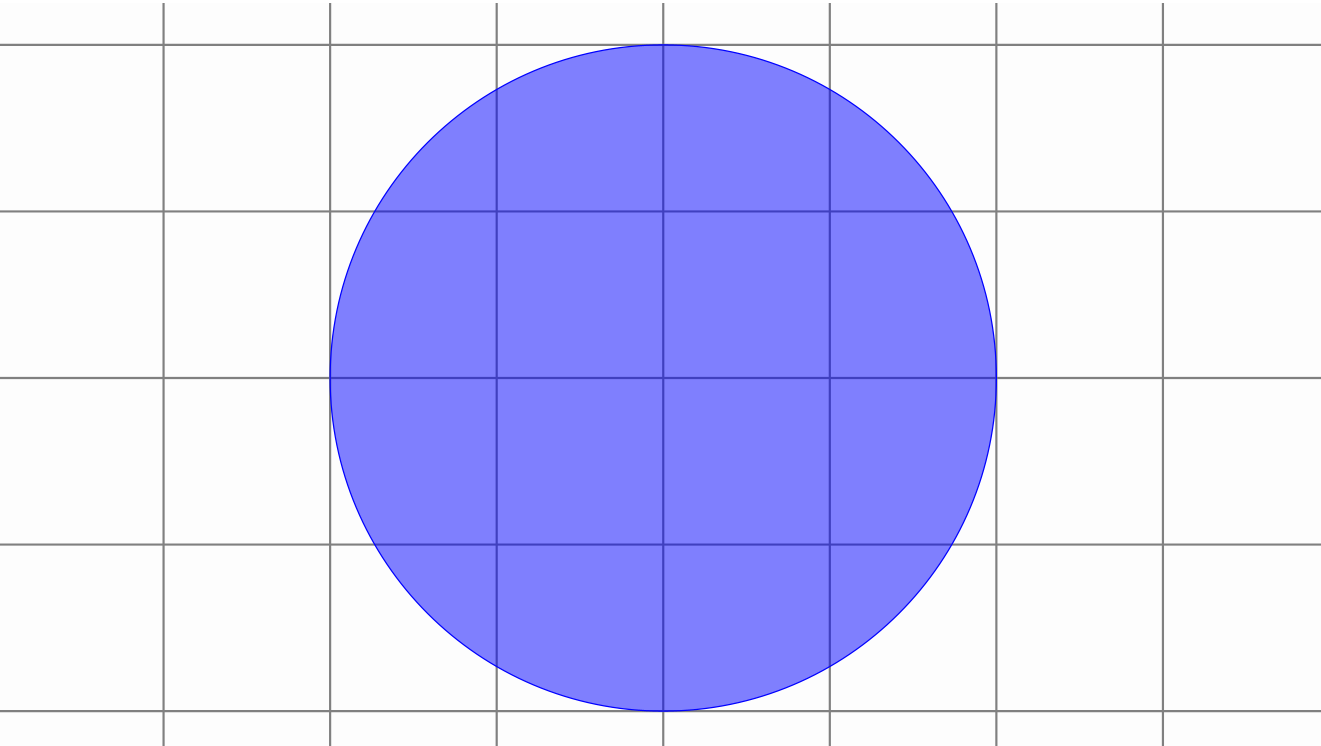
By default, grids are drawn using the gridPrimaryDefault and gridSecondaryDefault styles. You can read more about styles in the next chapters.
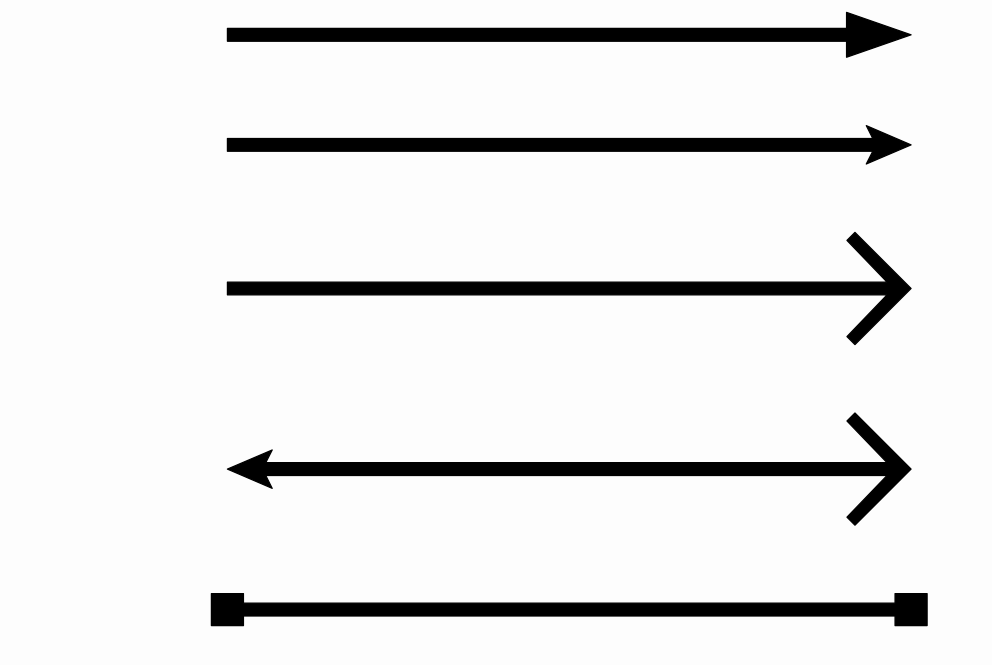
The Arrow class
Since v0.9.10-SNAPSHOT this class replaces the old Arrow2Dclass and provides a better and more flexible implementation.
Point A = Point.at(0, 0);
Point B = Point.at(1, 0);
Arrow ar = Arrow.make(A, B, ArrowType.ARROW1);
Arrow ar2 = Arrow.make(A.copy(), B.copy(), ArrowType.ARROW2)
    .stack().withGaps(.1).withDestinyAnchor(AnchorType.LOWER).toObject(ar);
Arrow ar3 = Arrow.make(A.copy(), B.copy(), ArrowType.ARROW3)
    .stack().withGaps(.1).withDestinyAnchor(AnchorType.LOWER).toObject(ar2);
Arrow ar4 = Arrow.makeDouble(A.copy(), B.copy(), ArrowType.ARROW2, ArrowType.ARROW3)
    .stack().withGaps(.1).withDestinyAnchor(AnchorType.LOWER).toObject(ar3);
Arrow ar5 = Arrow.makeDouble(A.copy(), B.copy(), ArrowType.SQUARE, ArrowType.SQUARE)
    .stack().withGaps(.1).withDestinyAnchor(AnchorType.LOWER).toObject(ar4);
add(ar, ar2, ar3, ar4, ar5);
camera.zoomToAllObjects();
waitSeconds(4);
Produces the following image:
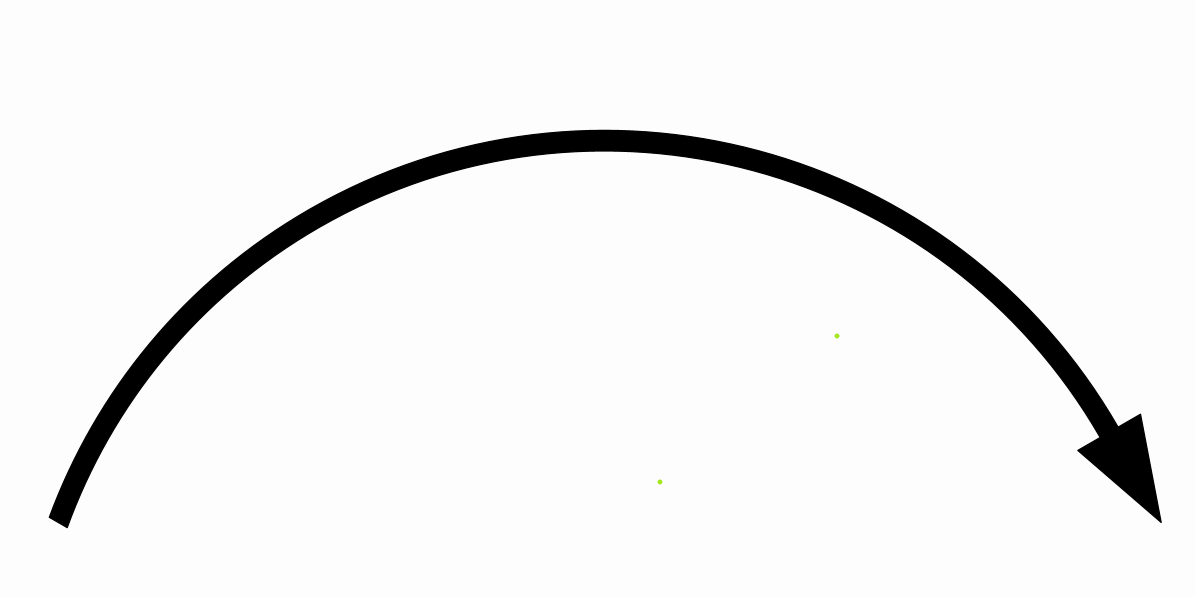
Arrow objects admit a curvature parameter, that allows for curved arrows:
Point A = Point.at(0, 0);
Point B = Point.at(1, 0);
Arrow ar = Arrow.make(A, B, ArrowType.ARROW1);
ar.setCurvature(60 * DEGREES);
add(ar);
camera.zoomToAllObjects();
waitSeconds(3);
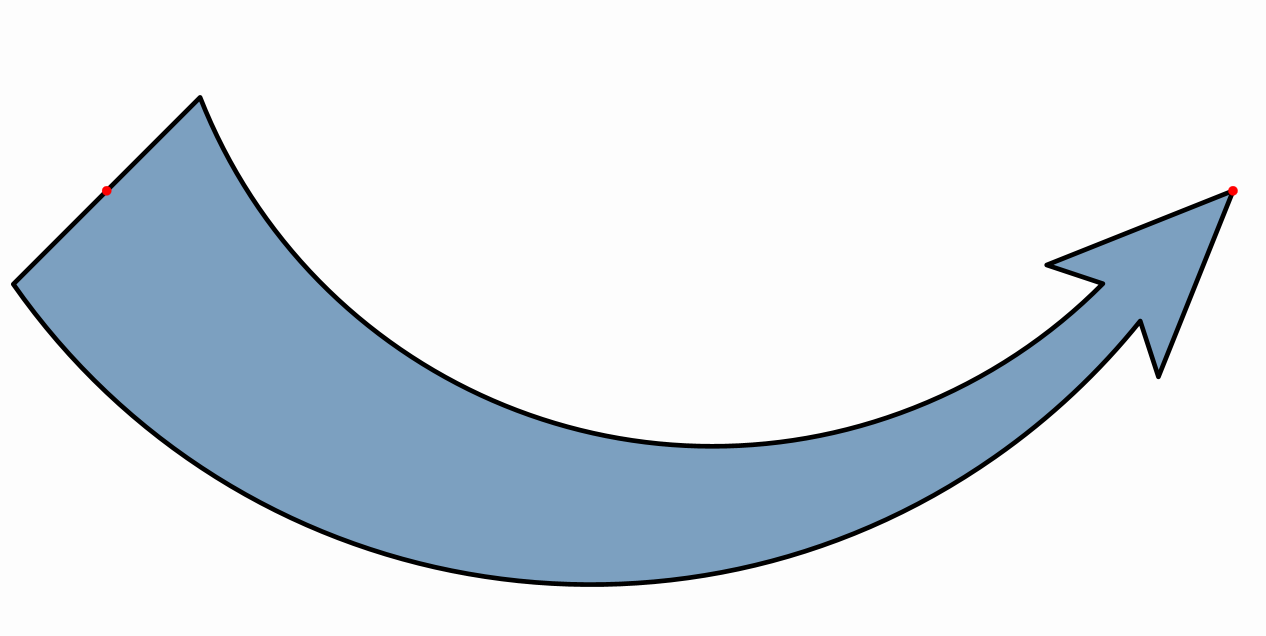
You can set individual scales for start and ending parts with the setStartScale and setEndScale methods:
//Points A,B are added to the scene in red color
Point A = Point.at(0, 0).layer(1).drawColor("red");
Point B = Point.at(2, 0).layer(1).drawColor("red");
Arrow ar1 = Arrow.make(A, B, ArrowType.ARROW2);
ar1.setArrowThickness(100);
ar1.setCurvature(-45 * DEGREES);
ar1.setStartScale(5);//Start is 5x the end
ar1.style("solidblue");//Style filled blue with contour
add(ar1, A, B);
camera.zoomToAllObjects();
waitSeconds(3);
The Delimiter class
The Delimiter is a extensible sign that adjust to 2 given control points A,B, may be brackets, braces, or parenthesis. The precise form of the delimiter is recalculated every frame, so if you animate the control points, the delimiter will automatically adjust to them. Note that the delimiter always draws to the “left” of segment AB, if you are looking from A to B. The last parameter of the builder is the gap you want to apply between the control point and the delimiter.
With the method setLabel(obj,gap) (from v0.9.4-SNAPSHOT) we can stack any MathObjectas a label, with the given gap between both. The method admits the overloaded version with a Stringthat will generate a LatexMathObject automatically. There is also the addLengthLabel method that creates a label that automatically updates its contents to the current length of the delimiter.
Also, from this version there are 2 new delimiters, LENGTH_ARROW and LENGTH_BRACKET.
Here you can see an example with delimiters:
Shape sq = Shape.square().center().style("solidBlue");

//A red brace with a x legend
Delimiter delim1 = Delimiter.make(sq.getPoint(2), sq.getPoint(1), DelimiterType.BRACE, .05);
delim1.setLabel("$x$", .1);
delim1.fillColor("#d35d6e");//This will set the color both to label and delimiter

//A green bracket with a yellow triangle as a legend. This triangle will rotate with the delimiter
Delimiter delim2 = Delimiter.make(sq.getPoint(1), sq.getPoint(0), DelimiterType.BRACKET, .05);
delim2.setLabel(Shape.regularPolygon(3).scale(.1), .1);
delim2.fillColor("#5aa469");//This will set the fill color both to label and delimiter
delim2.getLabel().fillColor("yellow").thickness(6);//Change style of label only

//FIXED: Label doesn't rotate.
//ROTATE: Label rotates with the delimiter
//SMART: Label rotates trying not to get "upside-down" (default value)
delim2.setRotationType(RotationType.FIXED);

//An orange parenthesis
Delimiter delim3 = Delimiter.make(sq.getPoint(0), sq.getPoint(3), DelimiterType.PARENTHESIS, .05);
delim3.style("solidorange");
delim3.setDelimiterScale(3);//Make a 3x bigger parenthesis
delim3.setLabel("3", .2);//Note that style solidorange will not be applied to this label!

add(delim1, delim2, delim3, sq);
play.scale(3, .75, 1.8, sq);
play.scale(3, 2, .25, sq);
play.rotate(3, 60 * DEGREES, sq);
play.shrinkOut(sq);
waitSeconds(1);
The TippableObject class
A tippable object is a MathObject that marks a specified point of a Shape. Any mathobject can be used as a tip. Two static methods implement specific tips: the equal length symbols and arrowhead symbols. A specialized subclass LabelTip attaches a LaTeX formula to a point of the shape. We’ll use a hexagon to show you six examples in one:
Shape reg = Shape.regularPolygon(6).center().style("solidblue");

//A black type 1 arrow head at the middle of one side
TippableObject tip1 = TippableObject.arrowHead(reg, .5 / 6,ArrowType.ARROW1)
    .setSlopeDirection(SlopeDirectionType.POSITIVE)//Locate it to the left side of the contour
    .layer(1);

//A LaTeX expression, color darkslateblue, at the middle of one side
//this expression rotates with the side, and the mark point is visible
LabelTip tip2 = LabelTip.makeLabelTip(reg, 1.5 / 6, "$a+b$")
    //                .setSlopeDirection(SlopeDirectionType.NEGATIVE)//Locate it to the right side of the contour
    .color("darkslateblue")
    .layer(1);

//A LaTeX expression, color firebrick, attached to a side, that does not rotate with the shape
LabelTip tip3 = LabelTip.makeLabelTip(reg, 2.5 / 6, "$x$")
    //                .setSlopeDirection(SlopeDirectionType.NEGATIVE)//Locate it to the right side of the contour
    .setRotationType(RotationType.FIXED) //The text shows with a fixed angle (doesn't align with the slope of the Shape)
    .color("firebrick")
    .layer(1);

//An "equal length" sign, with 2 marks
TippableObject tip4 = TippableObject.equalLengthTip(reg, 3.5 / 6, 2).layer(1);

//A solid orange circle
TippableObject tip5 = TippableObject.make(reg, 4.5 / 6,
                                          SlopeDirectionType.POSITIVE,//Align it through the contour
                                          Shape.circle().scale(.05).style("solidOrange")
                                         ).layer(1);

//A solid red square, aligned to the left of the shape point
TippableObject tip6 = TippableObject.make(reg, 5.5 / 6,
                                          SlopeDirectionType.NEGATIVE,
                                          Shape.square().scale(.1).style("solidRed")
                                         );
tip6.setAnchor(AnchorType.LEFT).layer(1);

add(reg, tip1, tip2, tip3, tip4, tip5, tip6);

//Rotate the hexagon and we'll see what happens to the tips
play.rotate(5, PI, reg);
waitSeconds(3);
Importing images
JMathAnim allows both bitmap and vectorial images. All bitmap formats supported by JavaFX can be added into the scene with the JMImage class, and the SVG format is (partially) supported using the SVGMathObject class.
Importing bitmap images
JMathAnim can import and transform all bitmap images supported by JavaFX, like png or jpg. Any affine transformation can be done to a JMImageobject. By default, the images are loaded in the resources/images/ folder in your project (see the styling chapter about specifying other search paths).
JMImage img=JMImage.make("euler.jpg").center().rotate(-5*DEGREES);
LatexMathObject text = LatexMathObject.make("All hail the great Euler!")
    .stack().withDestinyAnchor(AnchorType.LOWER).toObject(img);
Animation anim = Commands.moveIn(2, ScreenAnchor.LEFT, img);
playAnimation(anim, ShowCreation.make(2 ,text));
waitSeconds(3);
Importing SVG Objects
Let’s see it with an example: I used a free SVG file example from https://freesvg.org/donald-knuth. As with the bitmap images, the SVG files are loaded by default from the resources/images folder.
public void setupSketch() {
    config.parseFile("#light.xml");
    }

    @Override
public void runSketch() throws Exception {
    MultiShapeObject svg= SVGUtils.importSVG("donaldKnuth.svg");
    svg.setHeight(2).center();
    play.showCreation(svg);//Plays an animation drawing the svg object
    waitSeconds(3);
    }
You’ll obtain something like this:
For this to work, the donaldKnuth.svg file must be located at <your_project_root_dir>/resources/images/ folder. Later we will see the structure of the resources folder.
WARNING: The SVG import capabilities are currently limited, not all SVG commands are implemented, like gradients or the ARC command. So, not all SVG files can be imported succesfully.
Importing a SVG creates a MultiShapeobject, that holds many Shapeobjects. Each object of the SVG file is converted to a JMPath and stored in a Shapeobject. So, you can perform transformations and animations like any other Shape object.
The MathObjectGroup class
The MathObjectGroup class allows the management of large sets of MathObjectinstances as one single entity. For example, the following code creates a group with 3 shapes:
Shape square=Shape.square();
Shape triangle=Shape.regularPolygon(3);
Shape circle=Shape.circle();
MathObjectGroup group=MathObjectGroup.make(square,triangle,circle);
A MathObjectGroup inherits from the MathObjectclass so that you can perform methods like shift, rotate, scale, etc.
Any style change will be applied to all elements in the group.
group.setFillColor("cadetblue");//Apply this fillcolor to square, triangle and circle
Note that you don’t need to add the MathObjectGroup to the scene in order to show its members. You can add the objects you want to the scene individually. Adding a MathObjectGroup to the scene does not add the object itself, but is equivalent to adding all its members to the scene.
add(group);//Equivalent to add(square, triangle, circle)
This class becomes handy when you want to animate or position a large number of objects, as we will see in next chapters.
The Rect class
The Rect class represents a bounding box. If you are familiar with game programming or similar, you will know this concept. The bounding box of an object is the smallest rectangle which contains that object and which is used as a fast reference for collision detection. The bounding box itself is not drawable, but you can easily create a rectangle with its dimensions with the static method Shape.rectangle(Rect bbox).
Every MathObject (moreover, any class that implements the Boxable interface) has the method .getBoundingBox() to get precisely that.
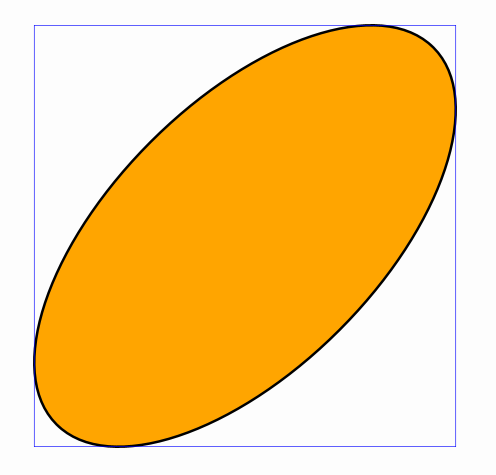
For example, the following code draws a ellipse rotated 45º counter-clockwise and its bounding box:
Shape s = Shape.circle().scale(1, .5).rotate(45*DEGREES).style("solidorange");
Rect r=s.getBoundingBox();//the bounding box of the ellipse
Shape bbox=Shape.rectangle(r).drawColor("blue");//Creates a blue rectangle with the dimensions of r
add(s,bbox);
waitSeconds(3);//Smile for the screenshot!
Here are some useful methods that the Rect class implements (you can see more detailed information in the Javadocs). In the previous example, where r was a Rect representing the bounding box of the ellipse:
r.xmin;//The most left x-coordinate of the Rect
r.xmax;//The most right x-coordinate of the Rect
r.ymin;//The lowest y-coordinate of the Rect
r.ymax;//The most upper y-coordinate of the Rect
r.getWidth();//Returns the width of the Rect
r.getHeight();//Returns the height of the Rect
r.addGap(.1, .2);//Creates a new Rect increased by .1 in x (left and right) and .2 in y (upper and lower)
r.getCenter();//Gets a Vec lying in the center of the Rect
r.getUpperLeft();//Gets a Vec lying the Upper-Left corner
r.getUpperRight();//Gets a Vec lying the Upper-Right corner
r.getLowerLeft();//Gets a Vec lying the Lower-Left corner
r.getLowerRight();//Gets a Vec lying the Lower-Right corner
r.centerAt(dst);//Moves the Rect so that its center lies in dst
r.getRotatedRect(45*DEGREES);//Returns the smallest Rect that contains the original rotated 45 degrees
r.getRelCoordinates(.25, .25);//Returns a Vec located at the relative coordinates (.25,.25) of the Rect
r.getRelCoordinates(.5,.5);//This is the same as r.getCenter()
Apart from bounding boxes, the Rect class is used to represent the mathview. The method getMathView() returns a Rect will represent all the visible area that is currently being drawn.
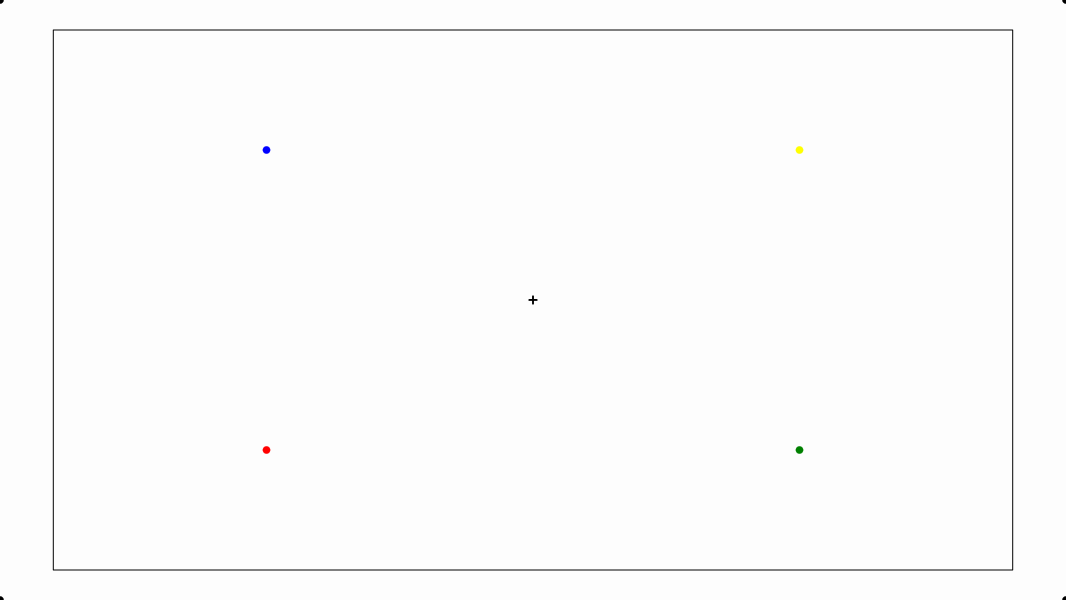
Thus, for example, the following code will draw some dots at key points of the screen (the methods thickness, drawColor and dotStyle control the appearance of the points and will be seen in the Styling chapter):
Rect mathView = getMathView();

//Note that these Rect methods return a Vec object
//and we must wrap them into a Point object in order
//to add them to the scene
Point center = Point.at(mathView.getCenter()).dotStyle(DotStyle.PLUS);//A black point with a plus sign at the center
Point UL = Point.at(mathView.getUpperLeft());//Black point at upper-left corner of the screen
Point UR = Point.at(mathView.getUpperRight());//Black point at upper-right corner of the screen
Point DL = Point.at(mathView.getLowerLeft());//Black point at lower-left corner of the screen
Point DR = Point.at(mathView.getLowerRight());//Black point at lower-right corner of the screen
Point Q1 = Point.at(mathView.getRelCoordinates(.25, .25)).drawColor("red");//Red point at (25%,25%) of the screen
Point Q2 = Point.at(mathView.getRelCoordinates(.75, .25)).drawColor("green");//Green point at (75%,25%) of the screen
Point Q3 = Point.at(mathView.getRelCoordinates(.75, .75)).drawColor("yellow");//Yellow point at (75%,75%) of the screen
Point Q4 = Point.at(mathView.getRelCoordinates(.25, .75)).drawColor("blue");//Blue point at (25%,75%) of the screen
add(center, UL, UR, DL, DR, Q1, Q2, Q3, Q4);
add(Shape.rectangle(getMathView()).scale(.9));//add a rectangle with size 90% of the screen
waitSeconds(5);
If you execute this code you will obtain an image like this: